USDA Forest Service Rocky Mountain Research Station Moscow FSL Soil and Water Engineering

A Probabilistic Approach To Modeling Erosion for Spatially-Varied Conditions

William J. Elliot, Peter R. Robichaud, David E. Hall, Christopher O. Cuhaciyan, Frederick B. Pierson, Peter M. Wohlgemuth

Abstract

In the years following a major forest disturbance, such as fire, the erosion rate is greatly influenced by variability in weather, in soil properties, and in spatial distribution. This paper presents a method to incorporate these variabilities into the erosion rate predicted by the Water Erosion Prediction Project model. It appears that it is not necessary to describe both the soil and the vegetation effects of the disturbance. Incorporating the vegetation effects on soil erodibility, and its associated variability, is sufficient--when combined with weather and spatial variability--to predict the probabilities of single storm and annual soil erosion rates in the years following the disturbance. By redefining the probability distributions of the soils, erosion during the recovering years, and impacts of mitigation on erosion can be determined from the same initial set of computer runs.
Keywords: Modeling, WEPP, Forest Fire, Erosion, Variability

Authors

William J. Elliot, Project Leader, USDA Forest Service, Rocky Mountain Research Station, Moscow, Idaho.
Peter R. Robichaud, Research Forester, USDA Forest Service, Rocky Mountain Research Station, Moscow, Idaho.
David E. Hall, Computer Specialist, USDA Forest Service, Rocky Mountain Research Station, Moscow, Idaho.
Christopher O. Cuhaciyan, Research Assistant, Washington State University, Pullman, Washington.
Frederick B. Pierson, , Research Hydrologist, USDA Agricultural Research Service, NW Watershed Research Center, Boise, Idaho.
Peter M. Wohlgemuth, Research Geologist, USDA Forest Service, Pacific SW Research Station, Riverside, California.

Introduction

Soil erosion by water is a complex process resulting from the interactions among a number of factors including weather patterns, soil properties, topography, and the influences of surface vegetation. Natural variability is a dominant characteristic of each of these factors, which makes predicting soil erosion rates difficult. In many forest conditions, and some rangeland conditions, erosion may be minimal under vegetated conditions unless the site is disturbed. Disturbances may be fire, logging, grazing, or severe precipitation events. The most extreme erosion rates occur when severe weather follows a major disturbance, particularly a severe wildfire.

Natural resource managers need tools to aid in predicting soil erosion following wildfires to estimate potential loss of onsite productivity, or potential offsite damage from sediment to aquatic ecosystems or other beneficial uses dependent on high-quality water. Most current erosion prediction tools were developed from agricultural erosion models, which are intended to provide long-term estimates of soil erosion rather than evaluate short-term risks. These models typically provide an "average" erosion value, and do not give any estimate of the likelihood of major upland erosion occurring.

Process-based erosion models may provide a means for evaluating complex distributions of disturbance for a number of possible weather sequences, but the effort to parameterize such models makes them unsuitable for widespread application. However, they can play a role in assisting researchers to analyze some of the interactions between erosion factors.

We are developing an interface to aid in the analysis of erosion prediction following fire, or a similar major disturbance, in forests and rangelands. This paper addresses a new method we are considering to incorporate the inherent variability associated with the predicted erosion rate, and how that variability is influenced by weather, spatial distribution of disturbances, and variability in soil erodibility.

Post-Fire Erosion Factors

Hillsides are more susceptible to erosion following a fire with decreased canopy and surface residue, and in some cases, a soil that is water repellent. Water repellency is a process that occurs when volatilized hydrocarbons released by the fire condense and coat soil particles and aggregates. These hydrocarbons repel water, which reduces infiltration rates and increases runoff, erosion and sediment delivery from hillsides. With time, they are dissolved by infiltrating water from rainfall and snowmelt. The reduction in vegetative canopy and surface residue dramatically increases the potential for soil erosion by increasing the area susceptible to raindrop impact and decreasing the potential for sediment deposition. In the year following a fire, vegetation regrowth can be rapid because of increased availability of soil nutrients, and decreased competition for sunlight and soil water by large trees. Hence, a burned site has a far greater likelihood of erosion the year following a fire, with the risk dropping rapidly as vegetation regrows, residue accumulates, and water-repellent chemicals break down and are washed away. For example, Robichaud and Brown (1999) measured a 90 percent drop in erosion from the first year to the second year following a severe wild fire in Oregon. In another study, the second year had greater erosion than the first because the climate the first year following the fire was drier than normal, whereas the second year following the fire was the wettest year in twenty in some areas near the study site (Robichaud 1998; McClelland et al. 1997).

Variability in Soil Erosion

Variability has been identified as a dominant feature in soil erosion processes following forest fires (Elliot et al. 2001; Robichaud 1996; Robichaud et al. 2000b). This variability may be due to weather, to soil properties, or to the spatial distribution of the disturbance.

Weather

Following a fire, if the weather is very dry, there will be little erosion, but there will also be little natural or seeded vegetation regrowth and little soil recovery from water repellent conditions. This means that the site can remain susceptible to erosion for another season. If the weather is very wet, and the soils are water repellent, there is a high likelihood of severe soil erosion, but also there will be rapid vegetation recovery. Runoff and erosion from rainfall or rain-on-snow events will be much greater than runoff from melting snow. Snowmelt hydrology is driven by variability in precipitation and temperature, and their interaction.

Once a site has recovered, rainfall rates in excess of 50 mm hr-1 or total rainfall amounts greater than 100 mm within a day or two are necessary before any significant upland erosion will occur. This seldom happens in many forested areas.

Fire

Fire effects on erosion are not homogenous (Robichaud and Miller 2000). Fire severity is a description of the impact of a fire on the soil and its litter layer. The severity of a fire varies widely in space, depending on fuel load, moisture conditions and weather at the time of fire, and the topography. Variability in fire often creates variability in severity, leading to mosaic landscapes. Areas that are drier, such as those near ridge tops, and areas with greater amounts of fuel, may experience higher severity fires. Areas that are wetter, such as riparian areas, will likely have less severe fires.

Soil and Spatial Variability

Soil properties are naturally highly variable. Soil erosion experiments generally measure standard deviations in erodibility values similar to the means, and coefficients of variation greater than 30 percent are common (Elliot et al. 1989). Soils near the tops of ridges tend to be coarser grained and shallower, whereas soils at the bottoms of hill slopes may be finer grained, while flood plains vary widely depending on past geomorphic processes. After fires, this variability increases with variability in water repellency (Robichaud 1996).

The combined effects of a mosaic in fire severity and soil variability result in spatial variability of soil erodibility that has some degree of predictability, but a great deal of natural variability. Spatial variability analyses have shown that following some fires, there are definite trends in degree of fire severity, whereas, the variability is evenly distributed on a hillslope or watershed following other fires (Robichaud and Miller 2000).

The WEPP Model

We chose to use the Water Erosion Prediction Project (WEPP) model as the driver for our proposed model. WEPP is a physically-based soil erosion model that describes the processes that cause erosion (Laflen et al. 1997). As long as the processes are correctly described, and the details of the site conditions can be described by the input variables, then the model can be applied. For some runs, WEPP may require up to 400 input variables describing soil and vegetative properties in great detail. Packaged with WEPP is a the daily weather generator, CLIGEN. CLIGEN stochastically generates daily weather sequences, which include the occurrence of precipitation, and the amount and duration of precipitation on a wet day (Nicks et al. 1995).

The WEPP model can be run either for single storms, with initial conditions such as soil water content, surface cover and soil erodibility specified for the storm, or in continuous mode where these values are automatically altered daily for a number of years of daily weather. Output options from WEPP include average annual runoff and erosion rates, annual erosion rates for the length of run, or event runoff and erosion rates for every runoff event during the period of simulation (Flanagan and Livingston 1995). The WEPP model has been applied to forest conditions with reasonable results (Elliot and Foltz 2001), and the database to support the model is increasing (Elliot and Hall 1997).

Elliot et al. (2000) have develop simplified interfaces to the WEPP model for forest conditions. One of the features of their interface for predicting erosion after fire (Disturbed WEPP) is that it gives both an "average annual" erosion rate, and the annual runoff and erosion rates associated with several return periods. The interface has two soil conditions related to fire, low severity and high severity. In addition, the user must specify the amount of surface cover. The Disturbed WEPP interface also includes a calibration feature to aid the user in ensuring the desired amount of surface cover is calculated by the vegetation routines in the WEPP model.

Duration of Predictions

Traditionally, runoff is predicted for a single 24-h event, whereas soil erosion rates are predicted for an entire year. The WEPP model can provide predictions for runoff and erosion for both annual averages and individual 24-h event summaries. Until user feedback is evaluated, it is difficult to determine whether it is better to develop annual or single storm models, or both.

Interactions Between Cover and Erodibility

We have found that in forest conditions, it is difficult to isolate cover effects from soil properties (Robichaud et al. 1993). We have also observed on the relatively long steep slopes in many forests, that rill erosion accounts for well over 90 percent of the soil detachment. From these observations, we hypothesized that if a soil has experienced a high severity fire, then the cover and erodibility can best be described within the soil properties of saturated hydraulic conductivity and rill erodibility. The role of cover is to alter these two variables, and does not need to be considered separately. Rather than to let the WEPP model adjust the soil erodibility values internally after calculating the amount of cover, we chose to specify them in the soil file. Minimizing vegetation growth in WEPP minimizes any further internal WEPP adjustments to soil properties due to vegetation.

To develop a data set of soil erodibility values, we first needed to know the relationship between cover, runoff, and erodibility for low and high severity conditions. We had developed an Internet interface (Disturbed WEPP, Elliot et al. 2000) which simplified parameterizing the WEPP model to generate the desired amount of cover. With the Disturbed WEPP interface, we calibrated the low severity and high severity vegetation conditions for a number of cover amounts (L1-L5 and H1-H5 in Table 1). We ran the WEPP model for a typical forest climate (Deadwood Dam, Idaho) and typical hillslope length (300 m) and steepness (zero at the top, 40 percent average, and 10 percent at the toe). We selected the sandy loam-textured forest soil. Using the WEPP MS DOS interface, we then developed a WEPP vegetation file to grow a minimum amount of vegetation, and calibrated the hydraulic conductivity in the WEPP soil file to give the same runoff, and the rill erodibility to give the same sediment yield as observed with each of the Disturbed WEPP conditions. The results of this calibration are presented in Table 1.

Input Variabilities

In order to estimate the probability of a given amount of erosion occurring, we first had to determine the probabilities associated with soil erodibility, weather, and spatial variation of soil erodibility.

Soil Probability Distribution

We developed distributions of soil erodibility values based on field research. Table 2 presents the probabilities that we assigned to different levels of fire severity. The predicted annual runoff and erosion rates for one set of typical conditions are included for reference. Table 2 shows that soil erodibility rates (Kr) can vary by more than 2 magnitudes following a fire, depending on the severity of that fire. The predicted erosion rates in Table 2 are within the observed range following fire in this geographic area (Elliot and Foltz 2001).

Spatial Variability

Spatial variability can be described with different distributions of severity on the landscape. Figure 1 shows that the distributions can be grouped into categories of erosion risk. Most managers prefer to describe burned sites by these categories of erosion risk as "High", "Moderate" or "Low", whereas our research has shown that we can group soils into only two categories of erosion severity, "High" and "Low" (Robichaud et al. 1993). To develop the three risks that users request, we defined the spatial distribution of severities in terms of High, Medium, and Low Risk. In a previous study, Robichaud and Monroe (1997) showed that dividing the hill into three elements is adequate to describe the range of variation of surface erosion as influenced by spatial variation. There have, however, been insufficient studies reported to assume any probability associated with a given distribution. Therefore, we decided to give each of the four distributions within each risk category shown in Figure 1 an equal probability of occurring (25 percent).

Climate Variability

Elliot et al. (2001) found that storms generated by the CLIGEN generator (version 4.30) for a 100-year period for Warren, ID, were similar to 6-hr duration storms with the same return period. Table 3 presents a comparison of generated individual storms to storms predicted by the NOAA Atlas (1973) compared to the 2, 5, and 10-yr storms from a 100-yr stochastic climate generated by CLIGEN for Deadwood Dam, Idaho. It appears that CLIGEN storms are between the 6 and 12-h storms predicted by the NOAA atlas.
To determine the probabilities associated with annual climates, a run for "typical" conditions (L3/H3) can be carried out, for 100 years of generated climate. The annual results can be ordered by erosion rate, and the fifth, tenth, twentieth, fiftieth, and seventy-fifth greatest values selected. The probabilities associated with each of these years will be 7.5, 7.5, 20, 27.5, and 37.5 percent, respectively. Single storms will be selected for the 20-, 10-, 5-, and 2-year erosion events. The probabilities associated with these events are 7.5, 7.5, 20, and 65 percent, respectively. Once the years necessary for these events are identified, only these years will be needed for the remaining combination of soil and spatial variabilities as described in the next section.

Combining Variabilities

To understand the combined variabilities of climate, fire severity, and soil properties, we defined a matrix of combinations of variables, and the probabilities associated with each of those variables. Table 4 gives an example of combining spatial and soil variability. Climate variability will also be part to the matrix. WEPP can then run for each combination of variables, 100 combinations of climate, soil, and spatial conditions for annual events, and 80 combinations for single storm events. The amounts of both event and annual precipitations, runoffs, erosion rates, and sediment yields are saved. The probability of each prediction occurring is equal to the product of the combined probability of occurrence of the three input variables (climate, soil, and spatial).

The precipitation, runoff, erosion, and sediment yield, by event and by year, are read from the event and annual WEPP output files. The results are linked to their probabilities, and the results sorted by the magnitude of the predicted value (precipitation, runoff, etc.). Table 5 gives an example of such results. From Table 5, there is about a 1 percent chance that erosion will exceed 5.5 kg m-2, a 5 percent chance it will exceed 2.8 kg m-2, a 74 percent chance that any erosion will occur, etc. The distributions for the annual results are shown in Figure 2, and for single events in Figure 3.

Precipitation occurs every year, and every event, so the values where the curve crosses the x-axis in Figures 2 and 3 are the minimum annual precipitation value and minimum 24-h precipitation necessary to cause runoff for these conditions. Annual and event runoff, erosion, and sediment delivery values are skewed. The points where the curves depart from the y-axes are the probabilities that the values are non-zero. Although not shown in these results, we noted during data manipulation that the largest values for runoff, erosion, and sediment yield did not necessarily correspond to the highest value of precipitation. For example, the ten-year return period precipitation event (which has the highest amount of precipitation) had no associated runoff or sediment yield.

Proposed Spatially-varied Model

To obtain the example results presented in Table 5 and Figures 2 and 3 currently requires considerable computer analysis time. We are developing a soil erosion interface for our Internet sites to use with the WEPP model, combined with a stochastic input data set, to estimate the probability of a given level of soil erosion (Robichaud et al. 2000b). The user will specify the climate, degree of fire risk (low, medium or high), soil texture, and topography; and will be given the option to use a storm generated by the interface, or to specify the desired storm amount and duration. Once the storm is selected, the interface will be run for the 20 combinations of soil and spatial distributions for five different years of weather, producing 100 possible annual soil erosion rates. A similar set of analyses will be carried out for individual events, with four events and 20 combinations of soil and spatial distribution. The results will be presented to the user in either a tabular (like Table 5), graphical (like Figures 2 and 3) or statement format. For example, the data will allow the proposed interface to make a statement like "There is a 10 percent chance that the erosion rate will be greater than 13.8 Mg ha-1, and a 26 percent chance there will be no erosion."

Erosion in Later Years

Forest sites recover quickly, as there is often a flush of new vegetation in the year following a fire. Once the initial WEPP runs are complete, the same runs can be used to predict erosion in the second and third year. Field observations and validation studies suggest that following fire the amount of exposed mineral soil is halved each year until the site is recovered. This usually takes about three or four years (Elliot and Foltz 2001).

To model the variability associated with recovery, a single set of low severity runs is required, with the probability distributions changing each year. The runs are already made as part of the first year analysis. The probabilities associated with the completed runs change in the recovering years. An example of this proposed method for modeling recovery by changing the probability distributions is presented in Table 6.

Effects of Mitigation

There are numerous mitigation methods to reduce runoff and/or soil erosion following fire (Robichaud et al. 2000a). We propose to incorporate the ability to predict the benefits of three of these methods: contour felled logs, mulching, and seeding (Robichaud et al. 2000b).

Contour Felled Logs

One of the mitigation methods is contour felled logs. Immediately following a fire, standing fire-killed trees are felled, delimbed, and staked on the contour. The logs then become sites for sediment deposition and surface storage of runoff water (Figure 4). The maximum storage capacity of these logs depends on the log spacing, the hillslope steepness, and the log diameter (Robichaud et al. 2000a). Ongoing measurement of the sediment collected behind these logs shows that the logs collect about half of the detached sediment from each storm, until their capacity is reached. The capacity can be estimated from the relationship:
(1)
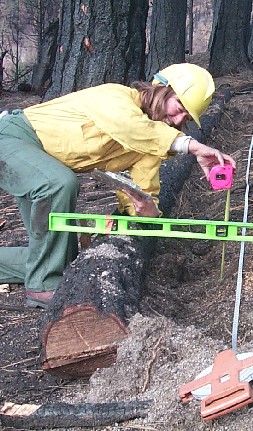
where Capacity is the maximum sediment stored (Mg ha-1), Dia is the mean log diameter (m), Spacing is the spacing on the hillslope (m) and Slope is the slope steepness (m m-1). We have observed that only about half of the eroded sediment is collect behind logs, and the other half is carried with the runoff to the channels (Robichaud and Brown 1999). Once the storage capacity predicted by equation 1 is full, then all eroded sediments will leave the hillside. For example, if equation 1 predicted a capacity of 3 Mg ha-1, and the predicted erosion was 2 Mg ha-1, then half the sediment, or 1 Mg ha-1 would be collected, and 1 Mg ha-1 would be delivered to the bottom of the hill. If an erosion rate of 8 Mg ha-1 were predicted, then the full capacity of 3 Mg ha-1 would be stored and 5 Mg ha-1 would be delivered.

Figure 4. Measuring the sediment storage capacity behind a contour felled log.

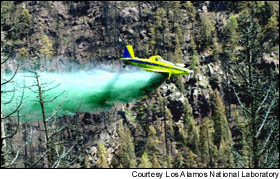
Figure 5. Aerial hydroseeding adding both seed and mulch following the severe fire near Los Alamos, NM in 2000 (Courtesy Los Alamos National Lab).

Mulching

Mulching is probably the most effective mitigation measure, but also the most expensive, considering the costs of labor and materials (Figure 5). There is a general relationship between amount of mulch, and surface cover:
(2)
where Crf is the fraction of the soil covered by the residue, Mf is the amount of residue (kg m-2) and cf is a coefficient that depends on the material ( = 6.4 for wheat straw; Flanagan and Livingston 1995). This relationship can be used to adjust the probability distributions presented in Table 6. For example, if a manager adds 500 kg ha-1 (0.05 kg m-2) to a site, from Equation 2, the cover would be about 27 percent. Adding this amount to the values in Table 6 leads to the revised distribution of erosion rates shown in Table 7. In the years following straw addition, the distributions in Table 6 are altered to reflect the increased groundcover. As the straw is decomposing, the effects of straw addition in year 1 will decline until there is no effect by year 3.

Seeding

Seeding grass, often from the air, is one of the most common mitigation treatments following fire (Figure 5). The grass seldom provides any benefit the year following the fire because there is insufficient water available for the seeds to germinate (Robichaud et al 2000a). In the second and third years, however, Robichaud et al. (2000a) report that many managers have observed an improvement in vegetation recovery. Within our proposed model, this benefit will increase the probability of greater amounts of cover in the recovery years. Although field data are scarce on exact cover values, Table 8 provides an initial proposal for altering the distributions in the recovering years, when compared to Table 6.

Summary

Variability is a dominant factor in soil erosion prediction on forest landscapes. Variables include climate, soil properties, the spatial distribution of fire severity and the benefits of mitigation. The range of erosion rates can vary by over two magnitudes due to spatial and soil variability, and an even greater amount when variability in climate is added. We have presented the principles behind a computerized tool that is now under development to aid managers in evaluating the runoff and erosion risks associated with wildfire for a given storm or during a given year. We have also presented methods to predict erosion probability distributions as sites recover, and if erosion mitigation measures are applied.

Conclusion

Describing the net effect of the disturbance through the soil properties is adequate, and separate vegetation files for different levels of disturbance are not needed. The effects of variability in climate, soils, and spatial distribution on variability in soil erosion can be modeled. This makes it possible to develop an interface to predict the probabilities associated with given levels of soil erosion following a forest disturbance and following erosion mitigation measures.

References

Elliot, W. J., A. M. Liebenow, J. M. Laflen, K. D. Kohl. 1989. A compendium of soil erodibility data from WEPP cropland soil field erodibility experiments 1987 & 88. NSERL Report No. 3. Columbus, OH: The Ohio State University, and W. Lafayette, IN: USDA Agricultural Research Service, 319 p.

Elliot, W. J., and D. E. Hall. 1997. Water Erosion Prediction Project (WEPP) forest applications. General Technical Report INT-GTR-365. Ogden, UT: USDA Forest Service, Rocky Mountain Research Station. 11 p.

Elliot, W. J., D. L. Scheele, and D. E. Hall. 2000. The Forest Service WEPP interfaces. Paper No. 005021. St. Joseph, MI.: ASAE. 9 p.

Elliot, W. J., and M. Foltz. 2001. Validation of the FS WEPP Interfaces for Forest Roads and Disturbances. Paper No. 01-8009. St. Joseph, MI.: ASAE. 15 p.

Elliot, W. J., P. R. Robichaud and C. D. Pannkuk. 2001. A Probabilistic Approach To Modeling Erosion for Spatially-Varied Conditions. Proceedings of the Seventh Federal Interagency Sedimentation Conference, March 25 to 29, Reno, NV. VI-33 - VI-40.

Flanagan, D. C., and S. J. Livingston (eds.). 1995. WEPP User Summary. NSERL Report No. 11, W. Lafayette, IN: National Soil Erosion Research Laboratory, 131 p.

Laflen, J. M., W. J. Elliot, D. C. Flanagan, C. R. Meyer and M. A. Nearing. 1997. WEPP--Predicting water erosion using a process-based model. Journal of Soil and Water Conservation 52(2), 96-102.

McClelland, D. E., R. B. Foltz, W. D. Wilson, T. Cundy, R. Heinemann, J. Saurbier, and R. Schuster. 1997. Assessment of the 1995 and 1996 floods and landslides on the Clearwater National Forest. Part I: Landslide assessment. Missoula, MT: USDA Forest Service, Region 1. 52 p.

National Oceanic and Atmospheric Admin. (NOAA). 1973. NOAA Atlas 2, Volume V - Idaho. Precipitation-frequency Atlas of the Western United States, Available online at <http://www.wrcc.dri.edu/pcpnfreq.html>.

Nicks, A. D., L. J. Lane, G. A. Gander. 1995. Chapter 2. Weather Generator. In Flanagan, D. C., and M. A. Nearing, USDA-Water Erosion Prediction Project Hillslope Profile and Watershed Model Documentation. W. Lafayette, IN: USDA Agricultural Research Service, 2.1-2.22.

Robichaud, P. R. 1996. Spatially-varied erosion potential from harvested hillslopes after prescribed fire in the interior northwest. PhD dissertation, University of Idaho, Moscow. 219 pp.

Robichaud, P. R. 1998. Slate Point Field Site, Bitterroot N.F. West Fork R.D. Internal progress report. Moscow, ID:USDA Forest Service Rocky Mountain Research Station. 1 p

Robichaud, P. R., and R. E. Brown. 1999. What happened after the smoke cleared: Onsite erosion rates after a wildfire in Eastern Oregon. Revised (November 2000) In: Olsen, D. S., and J. P. Potyondy (eds.). Proceedings AWRA Specialty Conference: Wildland Hydrology, Bozeman, Montana. 419-426.

Robichaud, P. R., and S. M. Miller. 2000. Spatial interpolation and simulation of post-burn duff thickness after prescribed fire. Accepted for publication in the International Journal of Wildland Fire.

Robichaud, P. R., and T. M. Monroe. 1997. Spatially-varied erosion modeling using WEPP for timber harvested and burned hillslopes. Paper No. 975015. St. Joseph, MI.: ASAE, 8 p.

Robichaud, P. R., C. H. Luce, and R. E. Brown. 1993, Variation among different surface conditions in timber harvest sites in the Southern Appalachians. International Workshop on Soil Erosion, Proceedings. Moscow, Russia. West Lafayette, IN.: The Center for Technology Transfer and Pollution Prevention, Purdue University, 231-241.

Robichaud, P. R., J. L. Beyers and D. G. Neary. 2000a. Evaluating the Effectiveness of Postfire Rehabilitation Treatments. General Technical Report RMRS-GTR-63. Ft. Collins, CO: USDA Forest Service Rocky Mountain Research Station. 85 p.

Robichaud, P. R., W. J. Elliot, F. B. Pierson and P. M. Wohlgemuth. 2000b. Risk assessment of fuel management practices on hillslope erosion processes. In Neuenschwander, L. F., and K. C. Ryan, (technical eds.) Proceedings from the Joint Fire Science Conference and Workshop. June 15-17, 1999. Boise, ID. Moscow, ID: University of Idaho 58-65.


Originally published as:
Elliot, W.J.; Robichaud, P.R.; Hall, D.E.; Cuhaciyan, C.O.; Pierson, F.B.; Wohlgemuth, P.M. 2001. A Probabilistic Approach To Modeling Erosion for Spatially-Varied Conditions. ASAE paper number 01-8006, presented at the 2001 ASAE Annual International Meeting, sponsored by American Society of Agricultural Engineers, Sacramento Convention Center, Sacramento, California, USA, July 30--August 1, 2001. St. Joseph, MI: ASAE. 16 p.

USDA Forest Service, Rocky Mountain Research Station, Moscow Forestry Sciences Laboratory
http://forest.moscowfsl.wsu.edu/