Rocky Mountain Research Station Logo beginning of contentUSDA Forest Service
Rocky Mountain Research Station
Forestry Sciences Laboratory - Moscow, Idaho
Moscow Home

Fire Effects  |  Risk Evaluation  |  White Pine Blister Rust  |  Decomposition Processes  |  Long-Term Soil Productivity  |  Microbial Processes  |  Publications  |  Microbial Processes Home

Decomposition Processes:

Decomposition Home

Objectives of this Study

Tour a Study Site

Results to Date
  1 Overview
  2 Priest River, ID
  3 Fall River, WA

Forest Locations

Cooperating Investigators


Contact:
Debbie Page-Dumroese
email Debbie

Last Revised:

Contact Webmaster
email webmaster

Microbial Processes > Decomposition Processes > Results to Date: 2 - Priest River Experimental Forest - Priest River, Idaho

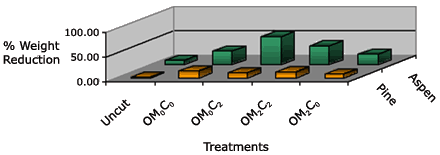
Weight Loss of Trembling Aspen and Loblolly Pine Stakes in all Five Treatments
(1.5 years after insertion)

% of weight reduction: Pine stakes - Uncut = 1%, OM0C0 = 15%, OM0C2 = 9%, OM2C2 = 10%, OM2C0 = 5%; Aspen stakes - Uncut = 4%, OM0C0 = 25%, OM0C2 = 50%, OM2C2 = 30%, OM2C0 = 18%

Fig. 1. Different rate of decomposition by treatment and species.

[view medium size diagram - 23K]
[view large size diagram - 30K]

Open Treatment Key in new window OR go to Treatment Key


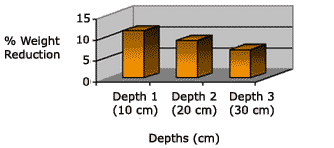
Weight Loss of Loblolly Pine Stakes by Soil Depth
(1.5 years after insertion)

% of weight reduction by depth: Depth 1 (10 cm) = 11%, Depth 2 (20 cm) = 8%, Depth 3 (30 cm) = 6%

Fig. 2. Different rate of decomposition (average) by depth for all treatments and for one species.

[view medium size diagram - 23K]
[view large size diagram - 31K]

Open Treatment Key in new window OR go to Treatment Key


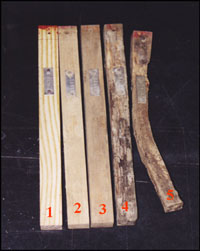
five wooden stakes labeled 1 to 5 from left to right; they look more decomposed (darker in color, shriveled and bent) as you go from left to right

Fig. 3. Pine stakes showing the amount of decay from the different extraction dates: 1) Stake condition before insertion, 2) 6 months, 3) 1 year, 4) 1.5 years, 5) 2.0 years.

[view medium photo - 38K]
[view large photo - 54K]

Open Treatment Key in new window OR go to Treatment Key


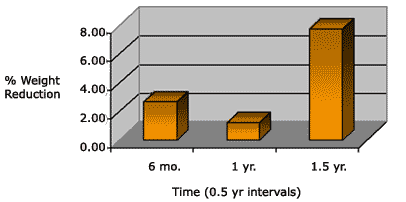
Weight Loss in the OM2C2 Treatment for

Loblolly Pine Stakes
(6 months, 1 year and 1.5 years after insertion)

% weight reduction for 0.5 year time increments: 0-6 months = 2.1%, 6-12 months = 1.1%, 1-1.5 years = 7.2%

Fig. 4. Different rates of decomposition over 1.5 years in one treatment and one species (each % amount indicates the amount of weight reduction for the previous 6 month period only, not the cumulative total).

[view medium size diagram - 22K]
[view large size diagram - 34K]

Open Treatment Key in new window OR go to Treatment Key


Weight Loss of Trembling Aspen and Loblolly Pine Stakes in all Five Treatments
(1 year after insertion)

Graph comparing % of weight loss between aspen and loblolly pine stakes (values are approximate) - % of weight loss in aspen stakes: Uncut = 8.5%, OM0 = 43%, OM2 = 60%; % of weight loss in loblolly pine stakes: Uncut = 1%, OM0 = 12.5%, OM2 = 19.5%;


Fig. 5

[view medium size diagram - 10K]
[view large size diagram - 10K]

Open Treatment Key in new window OR go to Treatment Key


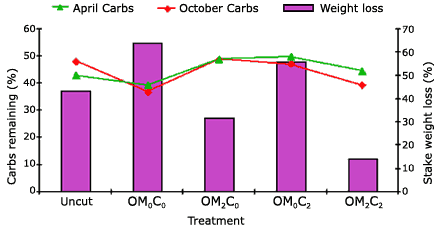
Total Carbohydrates Remaining and Weight Loss in Trembling Aspen Stakes
(April readings are 6 months after insertion, October readings are 1 year after insertion; Weight loss measured in October)

Graph showing % of carbohydrates remaining and weight loss in aspen stakes (values are approximate) - % of carbohydrates remaining in April: Uncut = 42.5%, OM0C0 = 39.5%, OM2C0 = 48.5%, OM0C2 = 49%, OM2C2 = 44%; % of carbohydrates remaining in October: Uncut = 48%, OM0C0 = 36%, OM2C0 = 30%, OM0C2 = 49%, OM2C2 = 39%; % of stake weight loss in April: Uncut = 37%, OM0C0 = 55%, OM2C0 = 27.5%, OM0C2 = 48%, OM2C2 = 12%


Fig. 6

[view medium photo - 15K]
[view large photo - 19K]

Open Treatment Key in new window OR go to Treatment Key


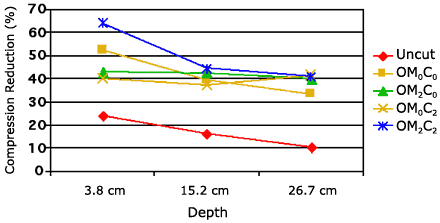
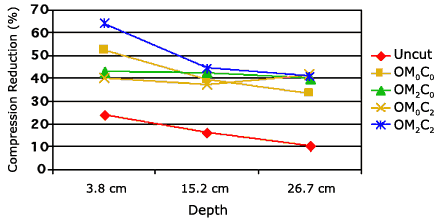
Compression Reduction (%) Results in Trembling Aspen Stakes
(1 year after insertion)

Graph showing % of compression reduction in aspen stakes 1 year after insertion (values are approximate) - % of compression reduction at a depth of 3.8 cm: Uncut = 24%, OM0C0 = 53%, OM2C0 = 43%, OM0C2 = 40%, OM2C2 = 64%; % of compression reduction at a depth of 15.2 cm: Uncut = 17%, OM0C0 = 40%, OM2C0 = 42.5%, OM0C2 = 37%, OM2C2 = 45%; % of compression reduction at a depth of 26.7 cm: Uncut = 10%, OM0C0 = 33.5%, OM2C0 = 40%, OM0C2 = 42%, OM2C2 = 40.5%


Fig. 7

[view medium size diagram - 10K]
[view large size diagram - 11K]

Open Treatment Key in new window OR go to Treatment Key


Next page - Fall River Experimental Forest results >