- Information by Map Unit
- Information by Topic
- Documents in SoLo
Links to other related sites
- About SoLo
-
- Mission
- Disclaimer
- Authors (complete list)
Hundreds of soil-site models have been published without being validated; such models may have prediction bias. The potential for prediction bias is especially high when many candidate predictor variables from a small sample are tested for during model development. Because of potential prediction bias, all soil-site models must be validated before being accepted. Two resampling procedures, cross-validation and the bootstrap, are introduced as simple statistical methods of validating soil-site models. These resampling methods provide a nearly unbiased estimate of the expected accuracy of a model. They are simple to computer program, and require no new data. The author recommends that soil scientists use a resampling procedure for the initial validation of soil-site models prior to expensive field validation.
Forest site quality in the Rocky Mountains is often expressed as site index: the average height of dominant and codominant trees at a base age of 50 or 100 years. Site index must be indirectly estimated where site trees are unavailable for direct measurement. A common indirect method is the soil-site model where site index is modeled as a function of soil, topographic, and vegetation factors. This approach has been accepted since the 1950's, and hundreds of soil-site equations have been published (Carmean 1975; Grey 1983).
However, many of these soil-site models have been published without validating them. The objective of this paper is to demonstrate that soil-site models can have severe prediction bias and therefore must be validated as part of the modeling process. I will then introduce some simple statistical validation techniques that require no new data and provide a nearly unbiased estimate of model accuracy.
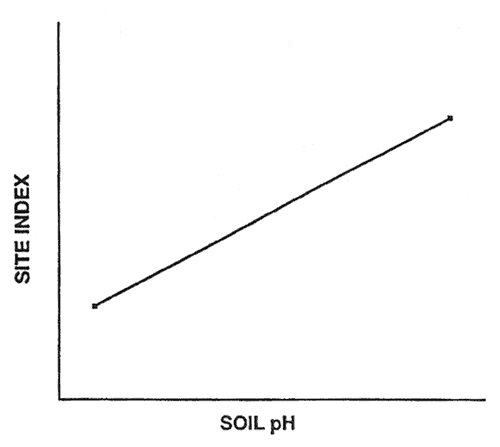
Suppose we measure site index and soil pH from two forest stands. We can then develop a regression model that predicts site index as a linear function of soil pH (fig. 1). The model has a high apparent accuracy; the site index of the two stands is perfectly predicted by our regression model. However, the model probably has prediction bias because the actual accuracy of the model is probably less than perfect prediction.
Figure 1—Linear regression based on two hypothetical sample cases. [view larger image - 8K]
The potential for prediction bias is great if many predictor variables are used in the model and the sample size is small. This is because spurious correlations (due to chance) may be incorporated in the model if many potential predictor variables are tested during model development. For example, I developed a regression model that had an R2 of 0.99 and a linear discriminant model that correctly classified 95 percent of the sample cases; however, both these models were totally useless because they were developed with random numbers (Verbyla 1986). McQuilkin (1976) illustrated the same prediction bias problem by developing a soil-site regression with real data. His regression equation had an R2 of 0.66; but when it was validated with independent data, the correlation between the actual and predicted site indices was less than 0.01 (McQuilkin 1976).
Because of potential prediction bias, soil-site models must be validated before being accepted. An intuitive approach is to randomly save half the sample cases for validation purposes. However, this is not a good idea. Consider figure 2: 20 sample cases are predicted by the linear discriminant boundary with an apparent accuracy of 90 percent. If we randomly select 10 sample cases to be excluded from model development (essentially sacrificed for model validation), two problems occur (fig. 3). First, we do not have a reliable estimate of the slope of the linear discriminant boundary (also our model degrees of freedom are reduced by half). Second, we only have one validation estimate of model accuracy, and this estimate is not very precise (fig. 3).
Figure 2—Linear discriminant boundary based on 20 hypothetical sample cases. [view larger image - 16K]
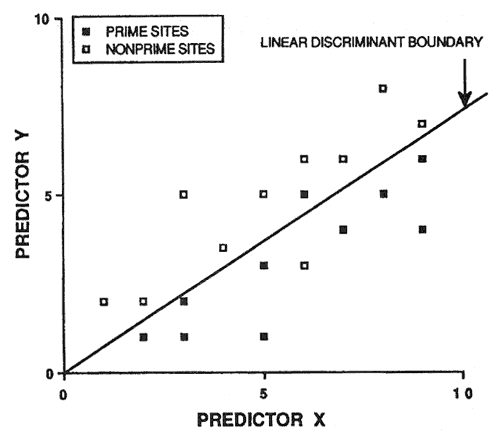
Figure 3—Random selection of half the original sample for model development and the remaining half for model validation. [view larger image of graph below - 12K]
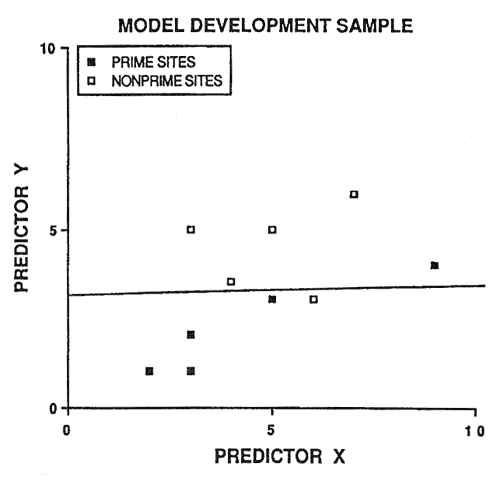
[view larger image of graph below - 12K]
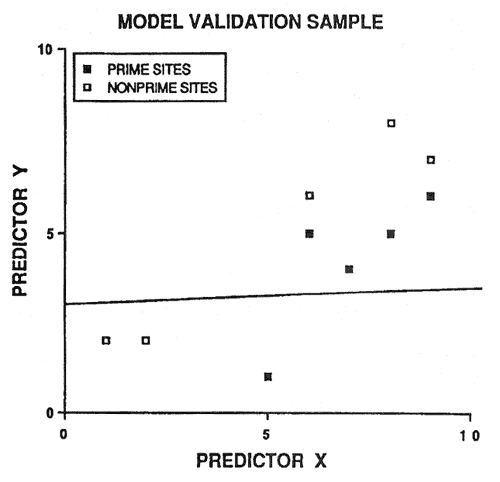
Fortunately, there are better statistical procedures for validating models. One method, called cross-validation (or the jacknife) has been used in development of soil-site models (Frank and others 1984; Harding and others 1985). Cross-validation yields n validation estimates of model accuracy (where n is the total number of sample cases).
The cross-validation procedure is:
The mean of the n estimates from step 3 is a nearly unbiased estimate of the expected accuracy of the model (if we were to validate it with new data from the same population) (Efron 1983).
A more precise estimate of expected model accuracy can be obtained using the bootstrap resampling procedure (Diaconis and Efron 1983; Efron 1983). The bootstrap resampling procedure is:
The process is repeated a large number of times (200-1,000). The expected model accuracy is then estimated as the weighted mean of the estimates from step 3.
I will present computer simulation results to illustrate these methods. My example uses a model developed with discriminant analysis; however, these resampling methods can be applied to most predictive statistical models such as linear regression and logit models.
In this hypothetical example, we are interested in developing a model that predicts prime sites versus nonprime sites from soil factors. In the simulation, 30 sample cases (simulated forest stands) were generated with 10 predictor variables (simulated soil factors). The linear discriminant analysis procedure assumes normal distributions and equal variances, therefore the predictor variables were generated with these properties. Because each stand was randomly assigned to be either a prime site or nonprime site, the expected classification accuracy of the model was 50 percent (no better than flipping a coin).
The simulation was repeated 1,000 times. In reality, the modeling process is performed only once. If we use the original sample cases to develop the model and then test the model with the same data (called the resubstitution method), we would have a biased estimate of the model's accuracy. On average, the model would appear to have a classification accuracy of 75 percent (fig. 4). Yet, the actual accuracy of the model would be expected to be only 50 percent if it were applied to new data.
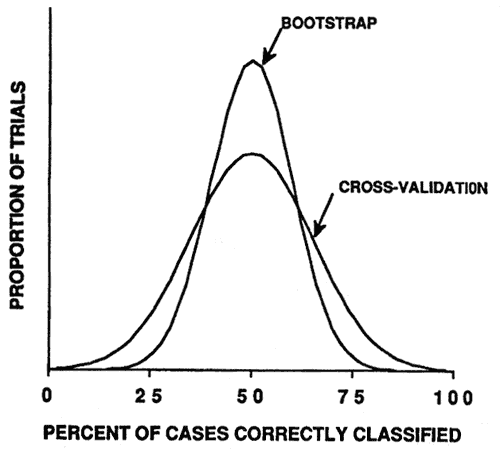
The same simulation was conducted using the cross-validation and bootstrap resampling methods to estimate model accuracy. Both methods produced nearly unbiased estimates of the expected accuracy of the model (fig. 5). The bootstrap method produced a more precise estimate and therefore is the best available method for estimating model accuracy (Efron 1983; Jain and others 1987).
Figure 4—Smoothed frequency distribution (N = 1,000 simulation trials) of resubstitution method estimates of model classification accuracy. [view larger image - 12K] [Text description of this graph]
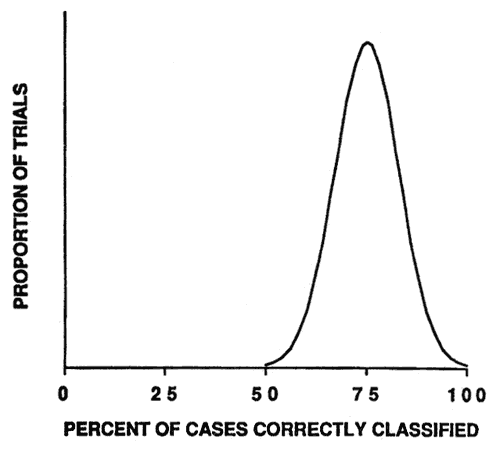
Figure 5—Smoothed frequency distribution (N = 1,000 simulation trials) of cross-validation and bootstrap estimates of model classification accuracy. [view larger image - 16K] [Text description of this graph]
Predictive statistical models can be biased. The prediction bias potential is especially high if sample sizes are small and many candidate predictor variables are tested for possible inclusion in the model. Because of the potential for prediction bias, predictive models must be validated. Resampling procedures such as cross-validation and the bootstrap require no new data and are relatively simple to implement (Verbyla 1989). There is no excuse not to use them.
A rational modeling approach is needed. The reliability and biological significance of predictive statistical models should be questioned (Rexstad 1988; Verbyla 1986). I believe that after models are developed, they should next be validated using a resampling procedure such as cross-validation or the bootstrap. The "acid test" should then be field validation to determine how well they predict under new conditions.
I thank C. T. Smith for reviewing the manuscript and offering constructive suggestions.
Carmean, W. H. 1975. Forest site quality evaluation in the United States. Advances in Agronomy. 27: 209-269.
Diaconis, P.; Efron, B. 1983. Computer-intensive methods in statistics. Scientific American. 248: 116-127.
Efron, B. 1983. Estimating the error rate of a prediction rule: Improvement on cross-validation. Journal of the American Statistical Assocation. 78: 316-331.
Frank, P. S., Jr.; Hicks, R. R.; Harner, E. J., Jr. 1984. Biomass predicted by soil-site factors: a case study in north central West Virginia. Canadian Journal of Forest Research. 14: 137-140.
Grey, D. C. 1983. The evaluation of site factor studies. South African Forestry Journal. 127: 19-22.
Harding, R. B.; Grigal, D. F.; White, E. H. 1985. Site quality evaluation for white spruce plantations using discriminant analysis. Soil Science Society of America Journal. 49: 229-232.
Jain, A. K.; Dubes, R. C.; Chen, C. C. 1987. Bootstrap techniques for error estimation. IEEE Transactions of Pattern Analysis. 9: 628-633.
McQuilkin, R. A. 1976. The necessity of independent testing of soil-site equations. Soil Science Society of America Journal. 40: 783-785.
Rexstad, E. A.; Miller, D. D.; Flather, C. H.; Anderson, E. M.; Hupp, J. W.; Anderson, D. R. 1988. Questionable multivariate statistical inference in wildlife habitat and community studies. Journal of Wildlife Management. 52: 794-798.
Verbyla, D. L. 1986. Potential prediction bias in regression and discriminant analysis. Canadian Journal of Forest Research. 16: 1255-1257.
Verbyla, D. L.; Litvaitis, J. A. 1989. Resampling methods for evaluating classification accuracy of wildlife habitat models. Environmental Management. 13: 783-787.
Paper presented at the Symposium on Management and Productivity of Western-Montane Forest Soils, Boise, ID, April 10-12, 1990.
David L. Verbyla is Visiting Assistant Professor, Department of Forest Resources, University of Idaho, Moscow, ID 83843.